


The May jobs report is in and any way you slice it, it’s jaw dropping.
If you take it at face value (as the stock market did), then the report is a hugely positive indicator that America’s economic situation is already on the road to recovery. While unemployment numbers have never been this high since the Great Depression, due to the COVID19 pandemic, it actually declined in May as employers added 2.5 million jobs. No one expected this.
So are we back?
Here’s another wrinkle as we delve deeper: the Bureau of Labor Statistics may have made an error in the jobs report that artificially deflated the unemployment numbers. Almost immediately, the BLS issued a statement saying they had misclassified furloughed workers as being “absent from work due to other reasons.”
Correcting for this error means the 13.3% unemployment rate in May is probably closer to 16.3%. And since April’s rate was 14.7%, that means all this optimism was for naught, right?
Well…
Yet another piece of information to consider: this error was made in March and April, too. Factoring in the correction, April would be around 21.2%. Meaning, since April and May should both have their respective unemployment rate adjusted higher, the decline in May is still reason for some optimism. After all, no data set is perfect; but directional data, as in whether the unemployment rate is going up or down, is still valuable data to have.
In fact, the BLS should probably be applauded for immediately putting out a statement that adds correction and clarification to their jobs report. How many organizations would admit to doing math wrong the very next day?
“BLS and our partners at the Census Bureau take the misclassification error very seriously, and we’re taking additional steps to address the problem.” - BLS
Good on them.
So back to the point: is there a jobs recovery in process? The numbers seem to suggest that the US may have peaked in terms of unemployment. Major cities are opening back up, and while the positive COVID cases are still on the rise, people are getting back to work one way or another. As long as hospitals aren’t being overwhelmed (which was the entire point of “flattening the curve”), jobs will be coming back.
So what does hiring look like right now?
Spring 2020 U.S. Hiring Data and Trends
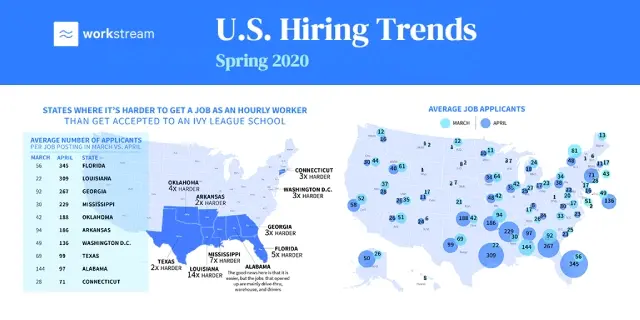
As you might expect with the high unemployment rate, even though jobs may be coming back, there is a giant pool of workers who are all competing for those jobs. We at Workstream put together proprietary data that should shed some light on what the current climate of job openings is like in our U.S. Hiring Trends for Spring 2020 Infographic:
-1.jpeg?width=693&name=Workstream%20Hiring%20Trends%20Spring%202020%20(2)-1.jpeg)
One of the most eye-opening statistics we found was that in many of the southern states, getting an hourly job is actually harder than getting into Harvard, which had an acceptance rate of about 5.2% in 2018. That’s 1 in 20 applicants. But comparatively, current competition for jobs is so stiff, with dozens or even hundreds of applicants for each position, it’s literally harder than getting into arguably the most prestigious Ivy League school.
But there are positive trends as well. Mitigating some of job losses are businesses such as grocery stores, delivery services, and assisted living facilities that are hiring as fast as they can; many seeing 100 - 400% increases in hiring.
Take a look at our infographic for more hiring information, and to get a better snapshot of the current state of America’s hiring and state of the workforce. For more resources and insightful posts, do check out the Workstream blog.